A Quick Tutorial on the Bochs Debugger
This is a small and quick tutorial on the Bochs Debugger.
The purpose of this tutorial is to show how easy and neccassary a good debugger is, such as the one included with Bochs.
Let's say that you have written a boot sector that should load a second stage loader and for some reason it just isn't. You can't figure out why. You have looked at all of your code, and you just have no idea why it just doesn't work.
Well, the first thing to do is to see exactly what is going on at each stage of your code.
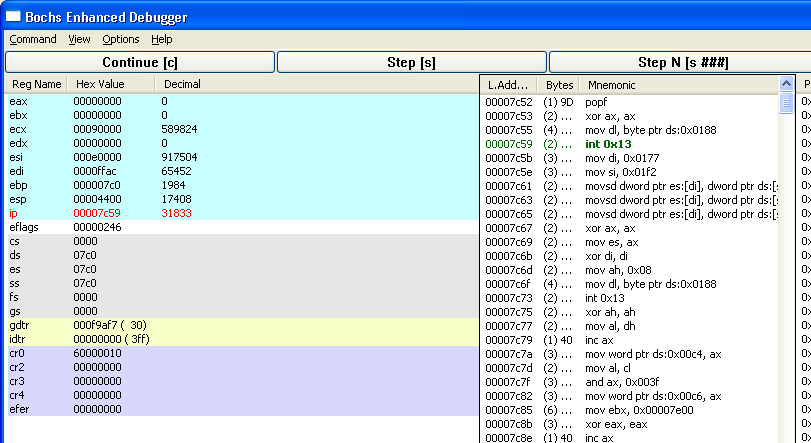
The following image shows the Bochs Debugger (in Windows XP). I have started the emulator and debugger, I have created a break point at 0x07C00 (the start of my boot code), clicked the "Continue" button, and the debugger has stopped at this break point and is now waiting for a command.
  To get to this point, you have:
   1) downloaded the bochs package from the first link above.
   2) executed the installation, pointing it to an install folder similar to the path below.
   3) created a bochsrc.txt file making sure to have the following line:
       display_library: win32, options="gui_debug"
      (an example of the bochsrc.txt file can be found at the source link above
   4) now with your floppy/hard-drive/ISO image and the bochsrc.txt file in the current
         directory, start the debugger with the following command line:
       D:\Bochs\release\bochsdbg -q
   5) now you should have a window similar to the one shown below.
   6) at the prompt, shown in the image below in red, type:
      lb 0x7C00<enter>        (where <enter> is the Enter Key)
   7) click the "Continue [c]" button.
   8) you now will be at the point where the BIOS has done all of its tasks, loaded your boot
      sector, and now is ready to execute the instruction at 0x07C00 (0x07C0:0000).
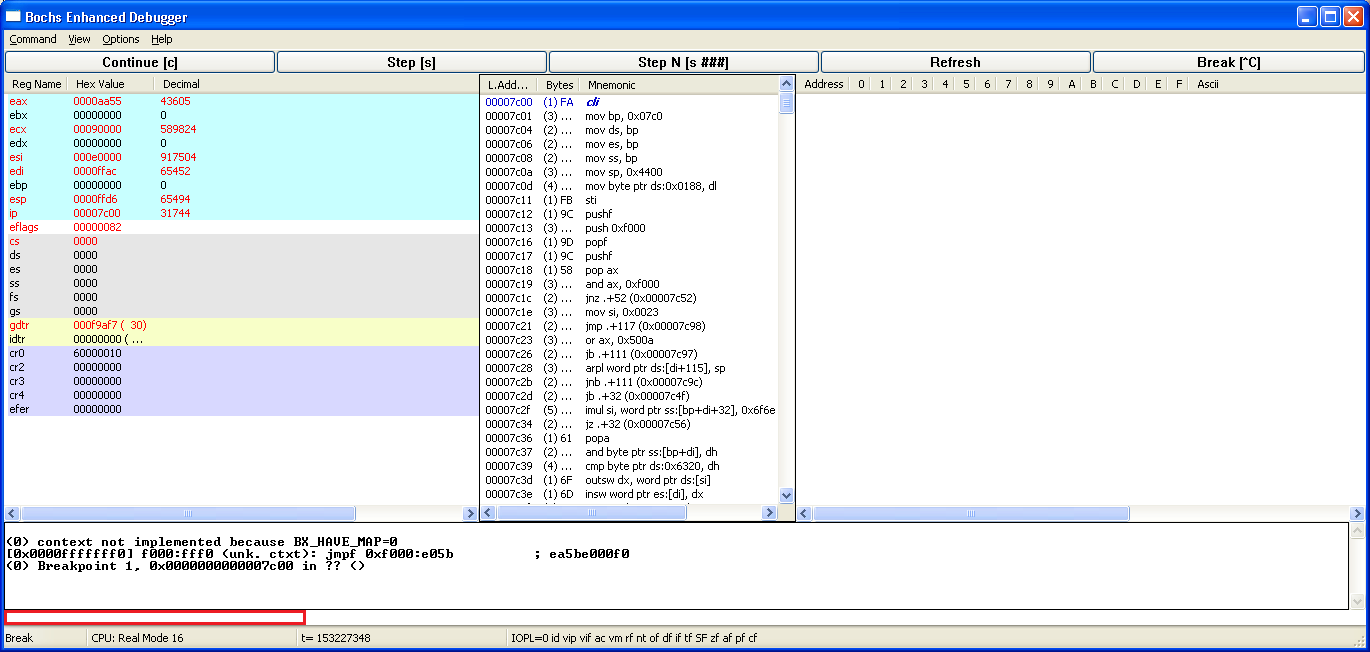
The column on the left shows the values of all the registers. The second column shows the actual code to be executed.
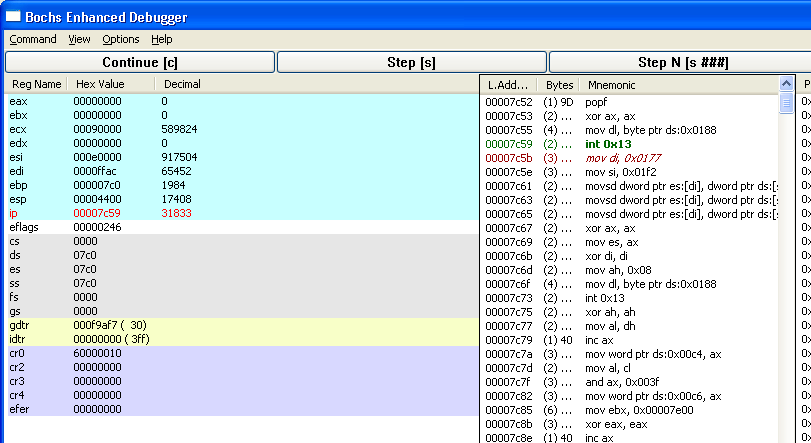
If I click on the "Step (s)" button, or hit the 's' key, it will step one instruction. The next image shows the results.
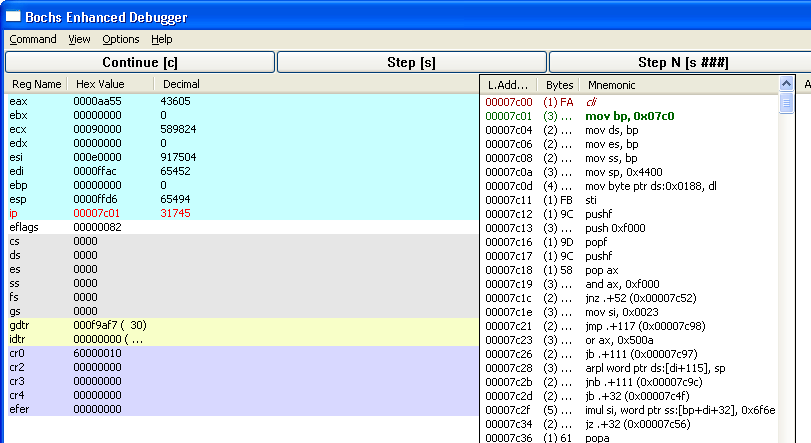
Notice that the IP register has now changed to red. This is because it changed from the previous step. If the Interrupt Flag was not already clear, when we stepped through the "cli" instruction, the eflags register would now be red also.
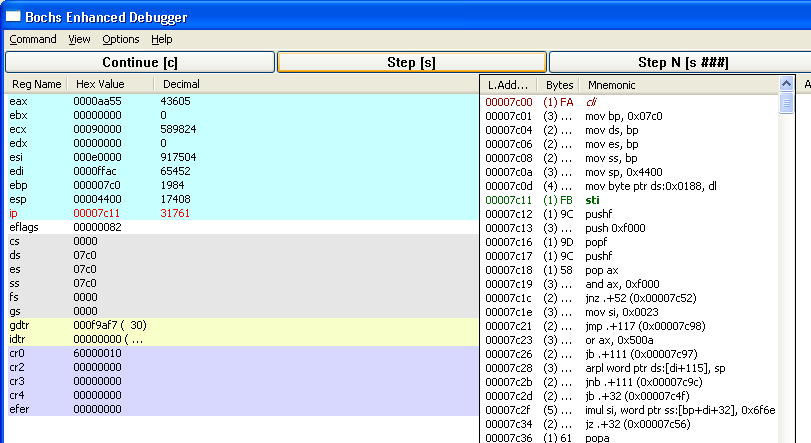
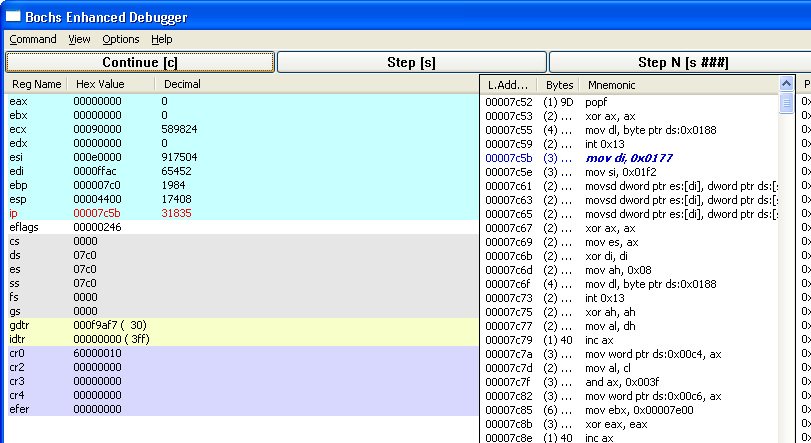
Now I step through the next few instructions and past the instruction that stores the DL register into the byte at DS:0x0188.
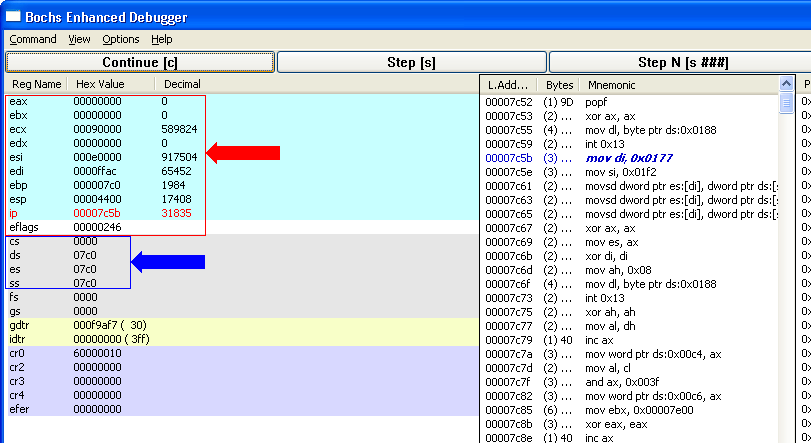
If you wish to see that the value at this address actually was changed, you can do a physical dump of the memory, by using the View Menu, "Physical Dump", and placing a physical value of 0x07D00 in the prompt.
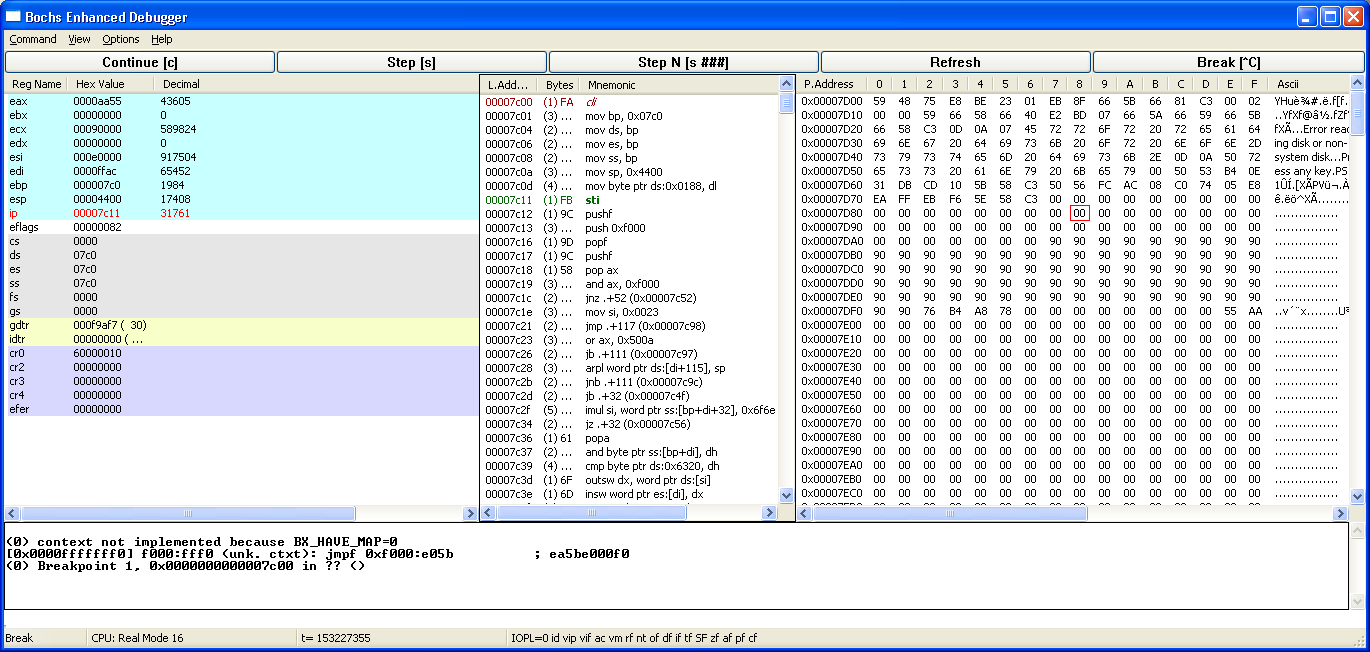
Since our DS register is 0x07C0 and we are in real mode, we know that the address DS:0x0188 is physical address 0x7D88. If we look, the address 0x7D88 is indeed, zero. (Red box was inserted for clarification)
I stepped through a few more instructions, either by pressing the 's' key or the Step button, or stepping through a few instructions using the 's n' command or the "Step n" button. For example, to step 10 instructions, use 's 10'.
(Note: The Bochs Debugger has a few small quirks. For example, if the step involves a jmp instruction and this new code is not shown in the second column, you might have to click on the "Refresh" button to update the instruction listing.)
I am now at the Int 13h instruction. If I step through it, it will actually go to the BIOS code. I am only interested in my code.
Therefore, I do want it to execute the Int 13h instruction and any neccassary BIOS code, but I don't want to step through it. I want to have the debugger execute the BIOS code, then stop when it returns at the next instruction after the Int 13h instruction.
To do this, you can put a break point at the instruction just after the Int 13h instruction. Either double click on the wanted instruction or type lb 0x07c5b in the prompt at the bottom of the window.
Now to execute the BIOS call, but not have to single step through it, since we have the break point set, hit the "Continue" button or use the C command.
Notice now that the current location is at the break point. This is where we can look at the carry flag and other registers to see if the BIOS call was successful.
See that the eflags register has the carry flag clear and the EAX register is zero. This particular BIOS call clears the carry and the AX register on a successful call.
This tells us that at this point, our code is successful. The error must be further along. We can continue to step though the code until we find something wrong.
If we don't want to step through a lot of code, we can place magic break points within our code. For example, if we use the instruction xchg bx,bx (or xchg ebx,ebx in pmode/unreal mode), and give the following line in our bochrc.txt file:
magic_break: enabled=1
the debugger will break at each of these instructions it encounters. Therefore, place this instruction at various places within your code and run the debugger again. At each break point, check registers and other memory areas to see that they are actually what they should be. If so, Continue to the next break point, doing this until you find that the current position is now not valid.
This was a small tutorial to show what a good debugger can do and to show how easy it is to use and show you where your code is and what it does. It is not detailed, nor a full tutorial. I simply want to show what a good debugger can do for your code.
Hope this helps. If you have any questions, please let me know.